PRIORITY ODS
TEN YEARS OF ACHIEVEMENTS
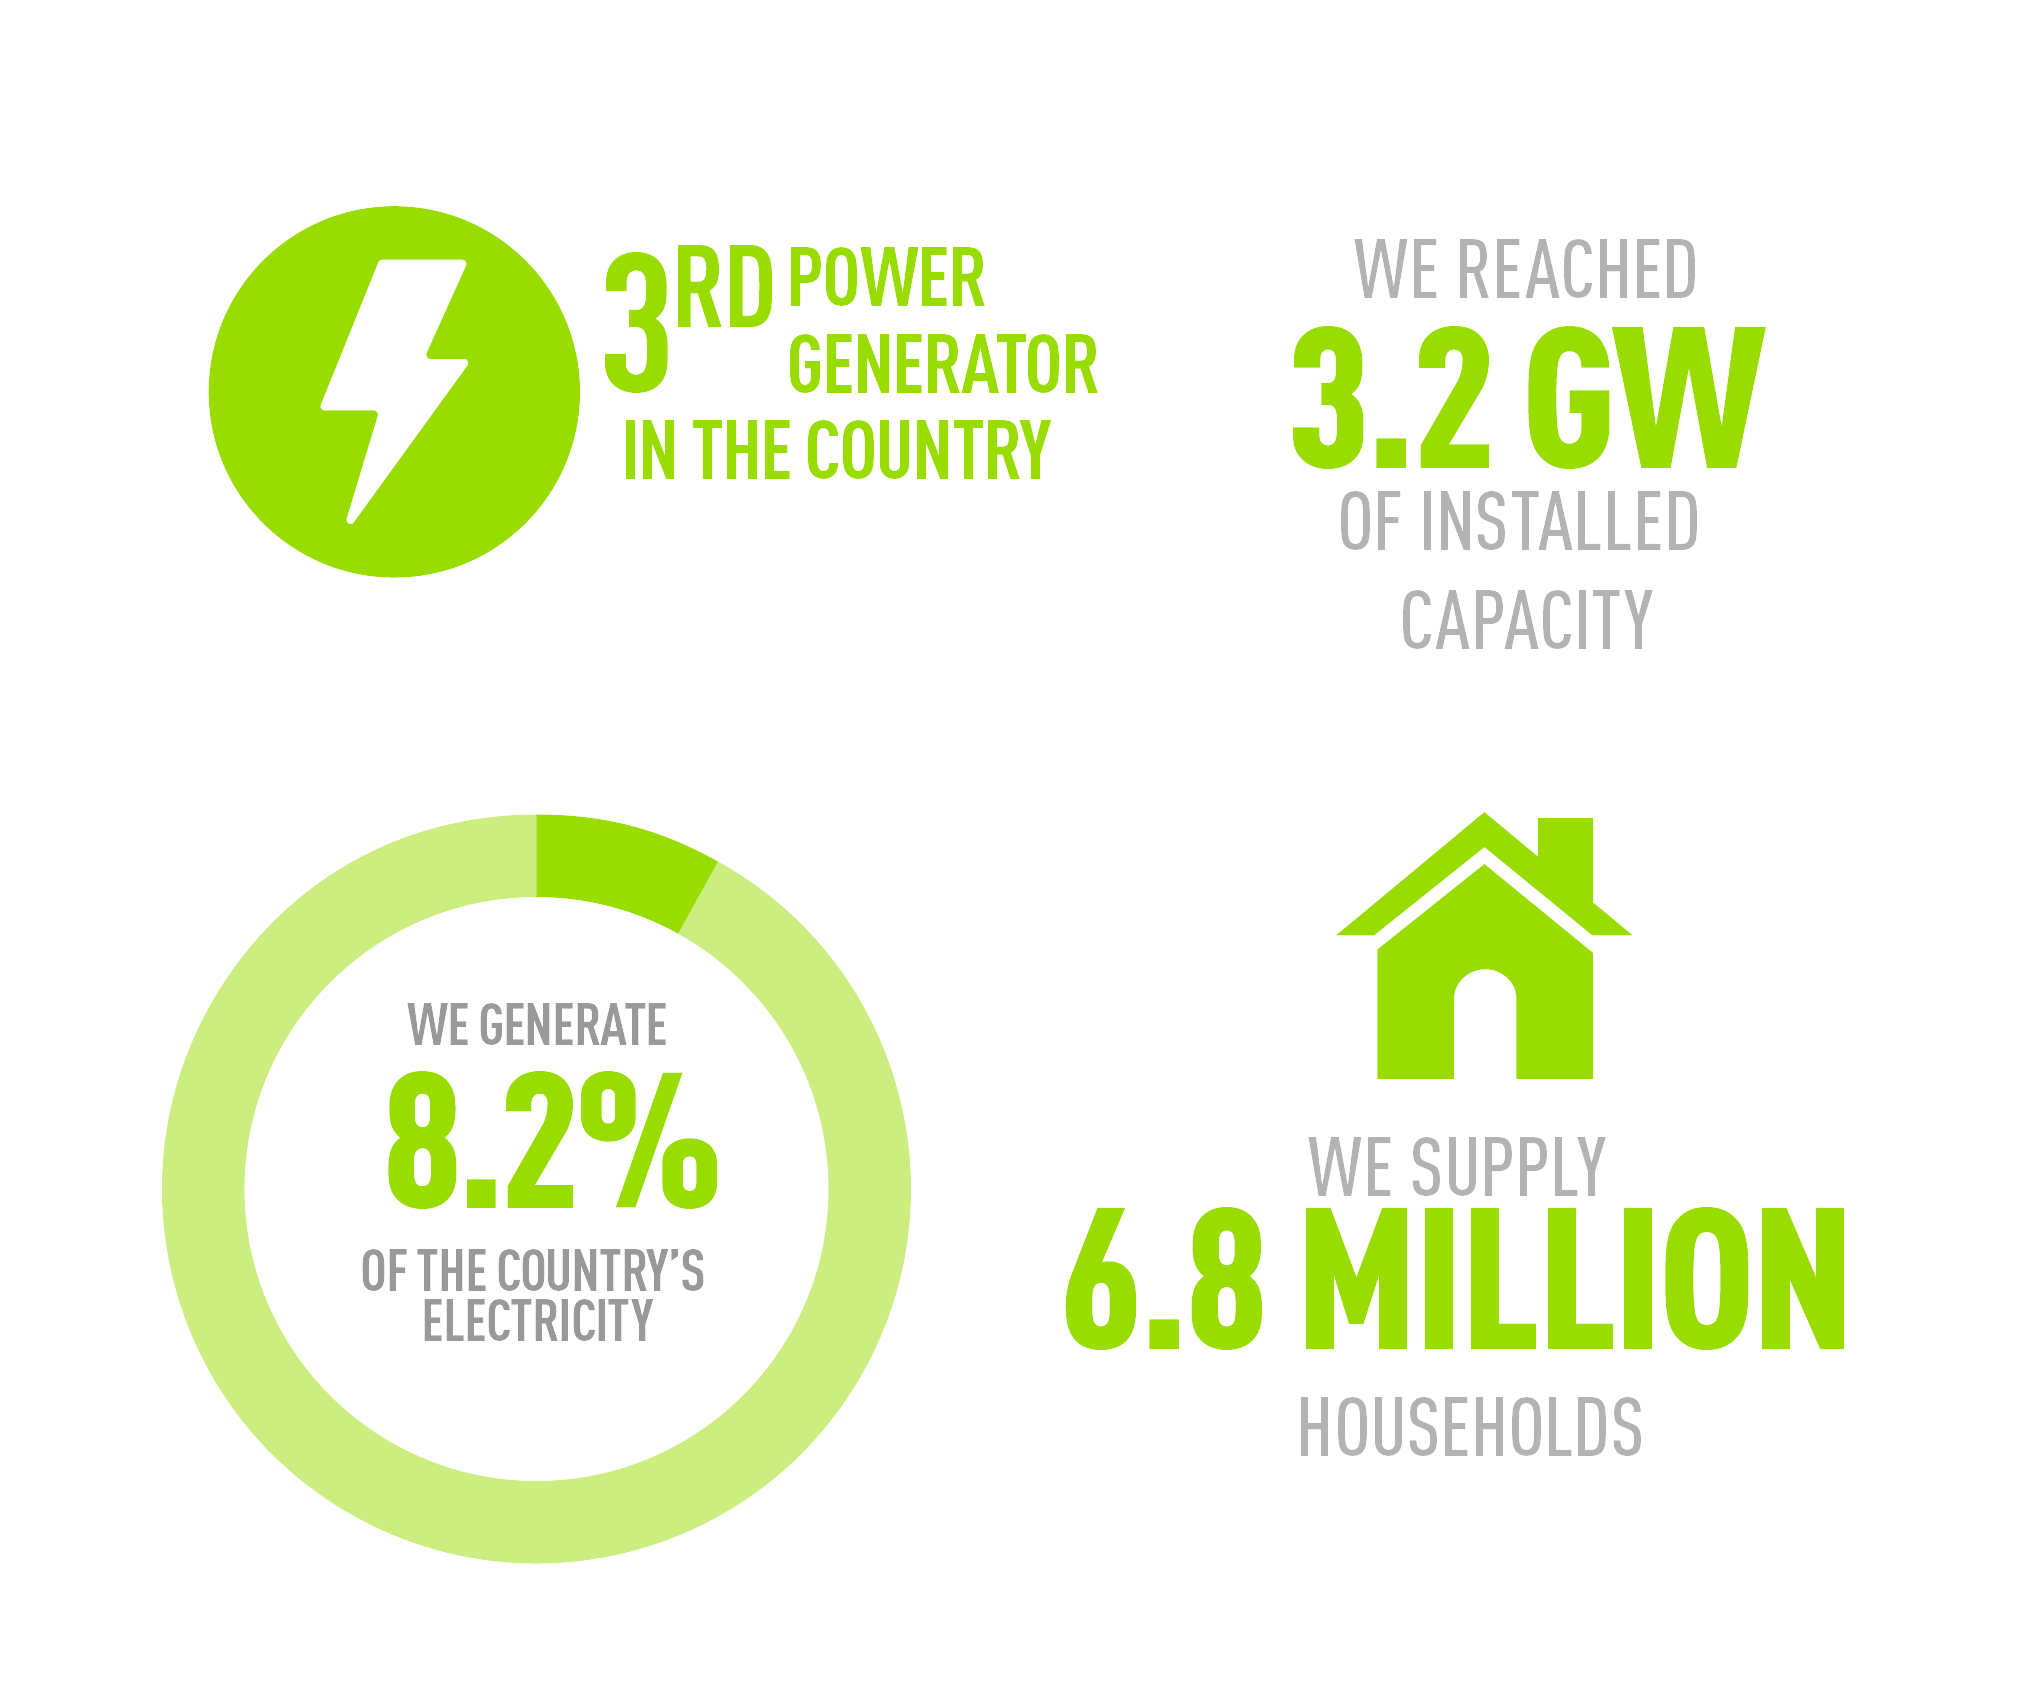
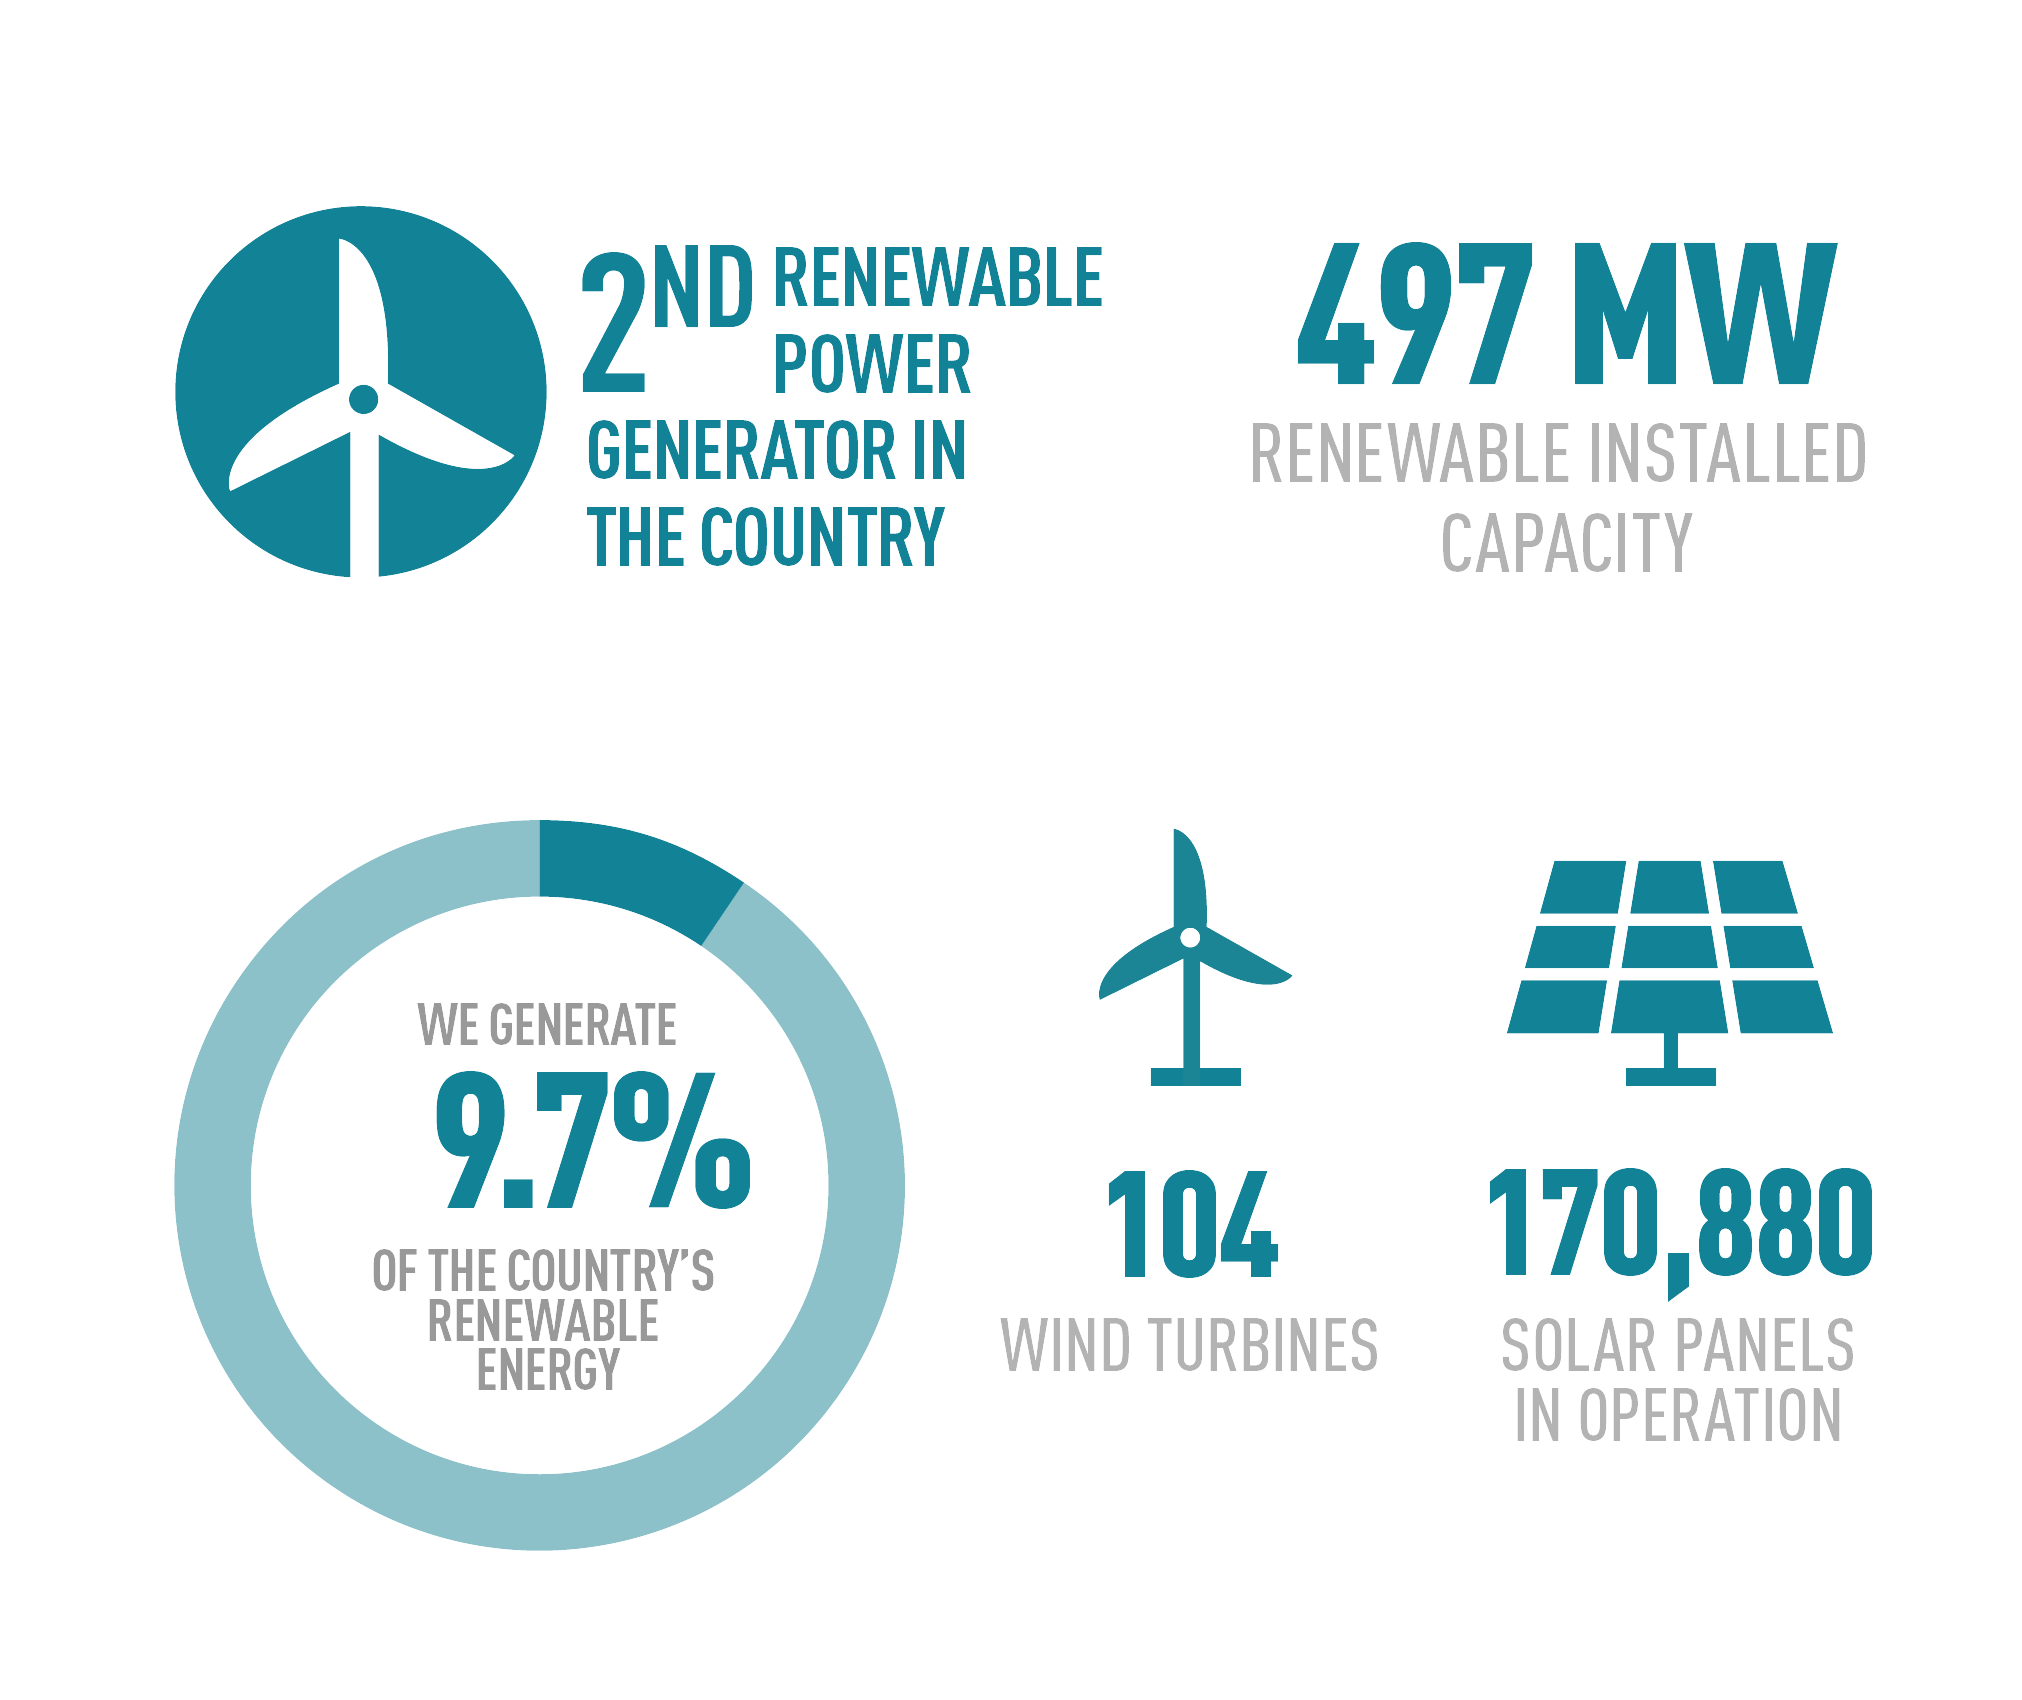
IN 10 YEARS, THE COMPANY HAS CONSOLIDATED ITS POSITION AS ONE OF THE POWER GENERATION LEADERS IN ARGENTINA
HIGHLIGHTS
.jpg)
Zonda Solar Park
Zonda Solar Park inauguration, our first solar park in San Juan.
Located in the town of Bella Vista, department of Iglesia,
the Zonda has an installed capacity of 100 MW, equivalent
to the energy used by more than 88,000 homes and avoids the
emission of more than 110,000 tons of carbon dioxide per year.
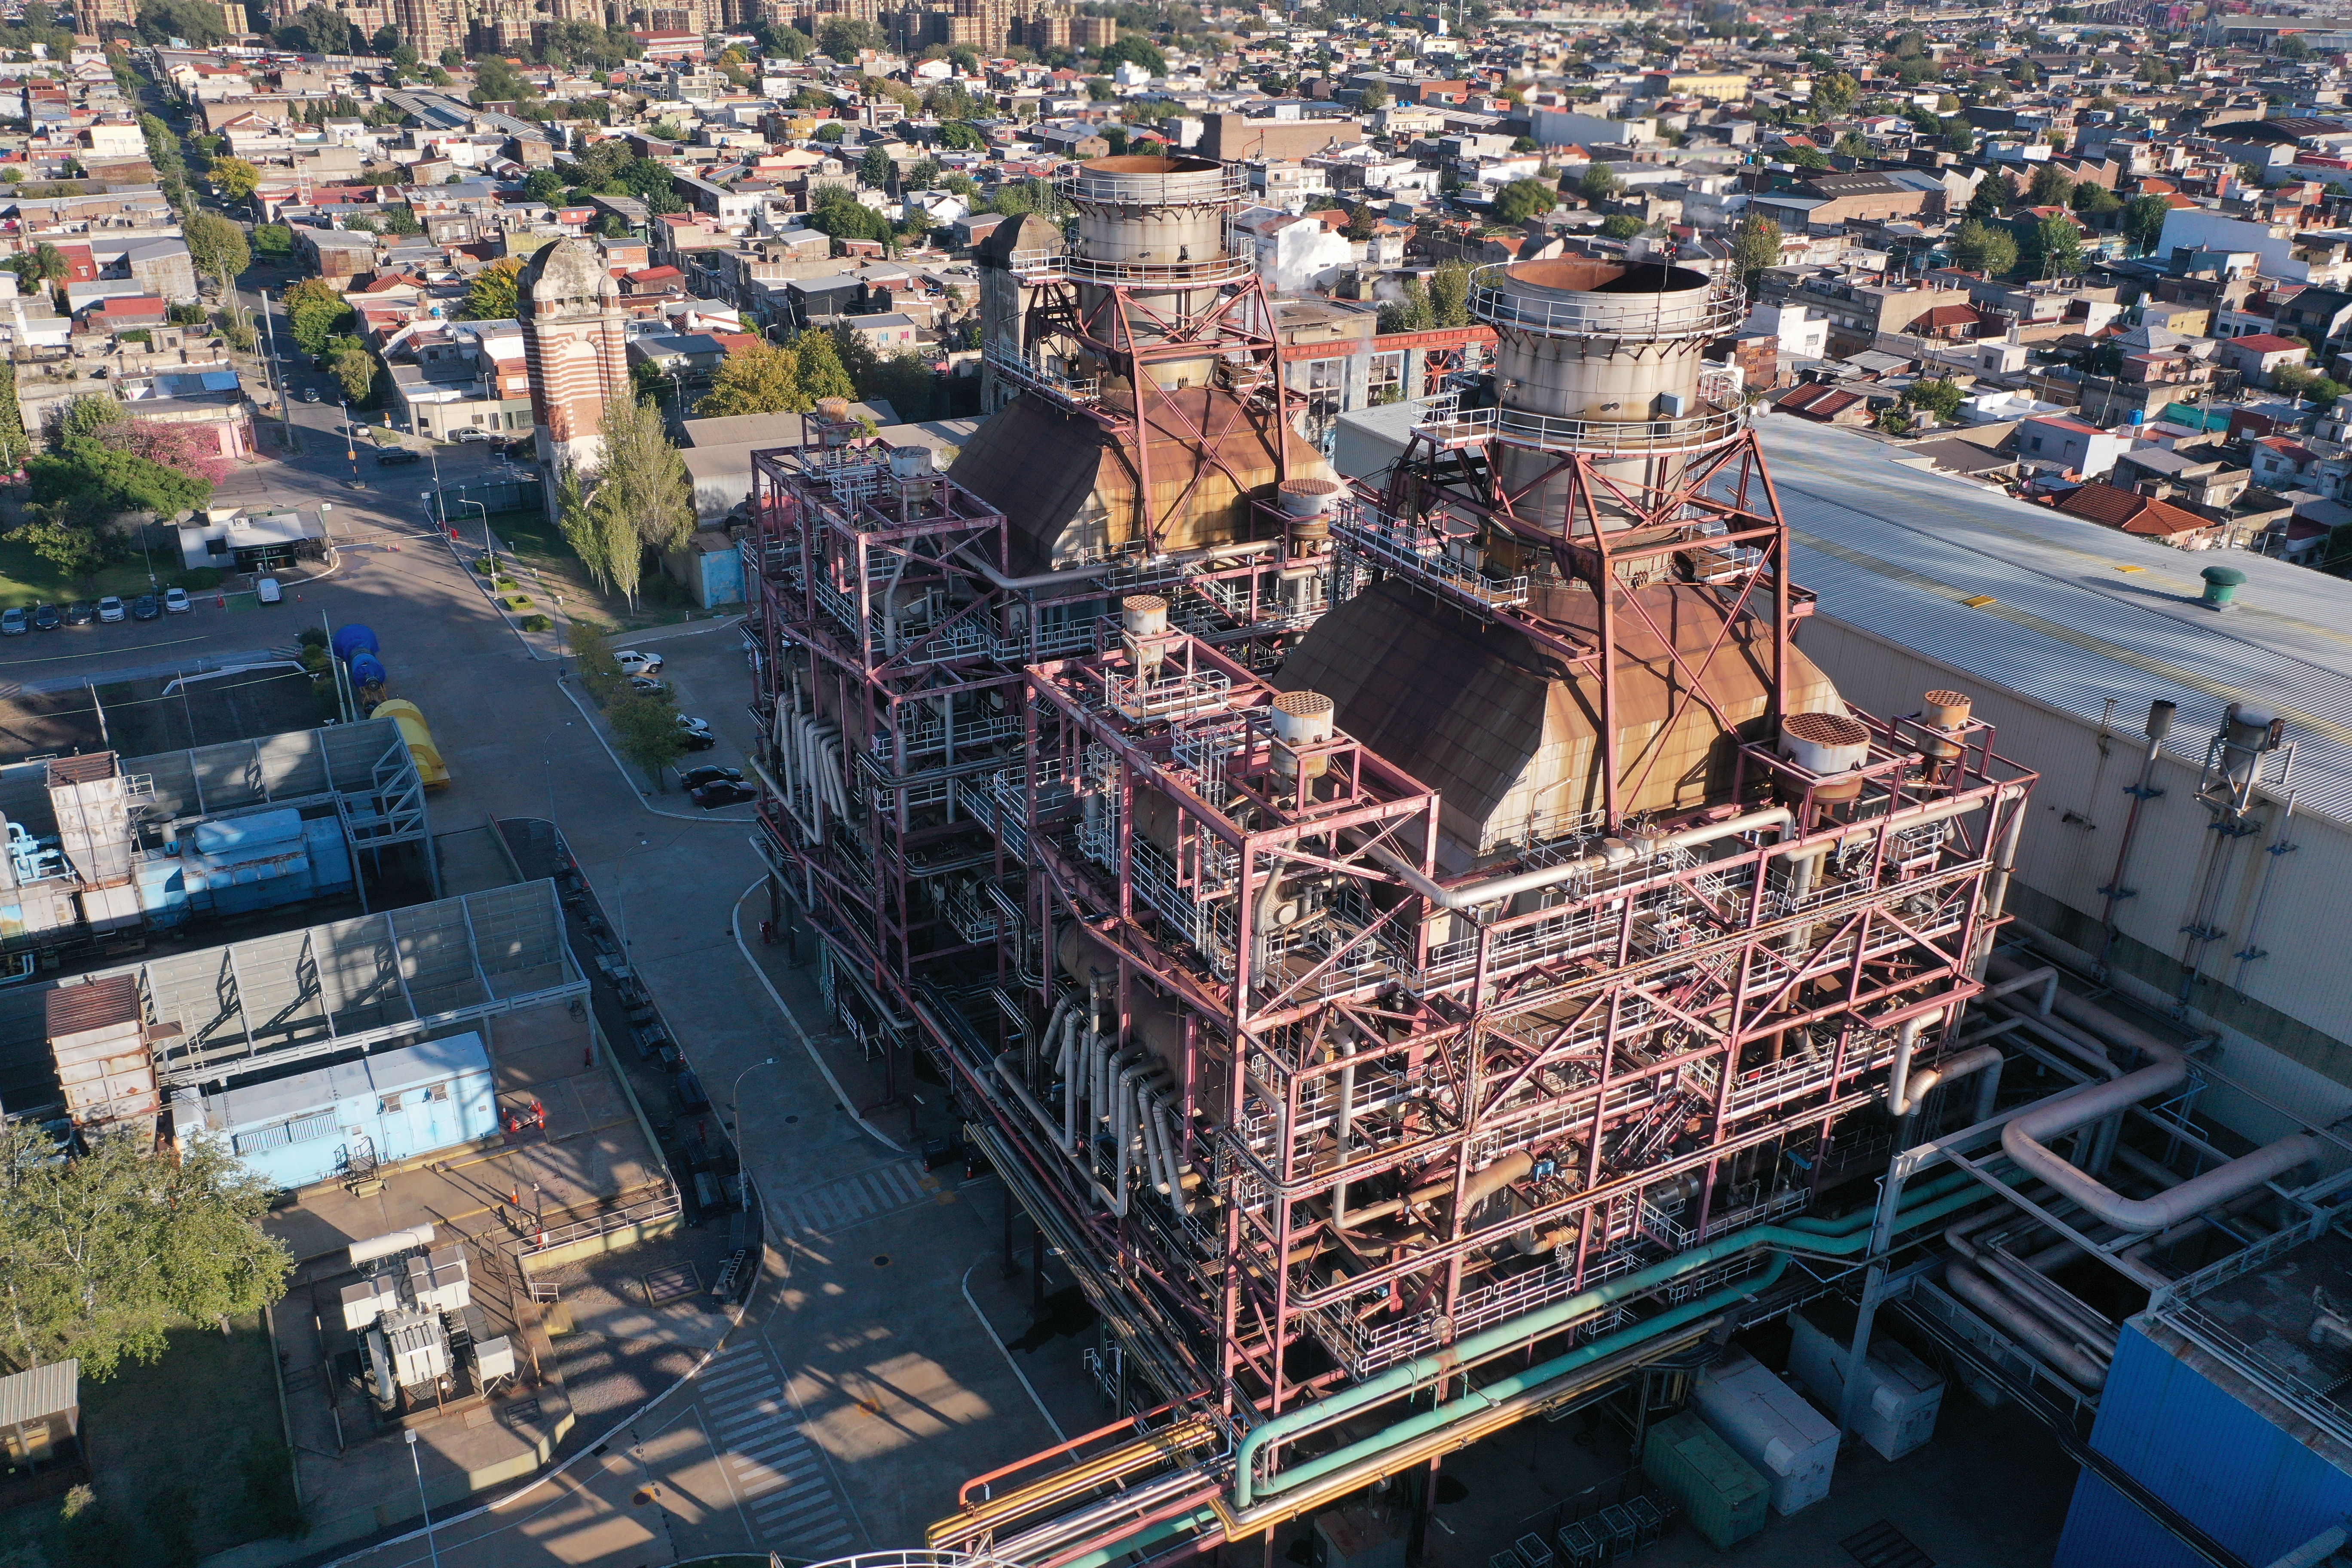
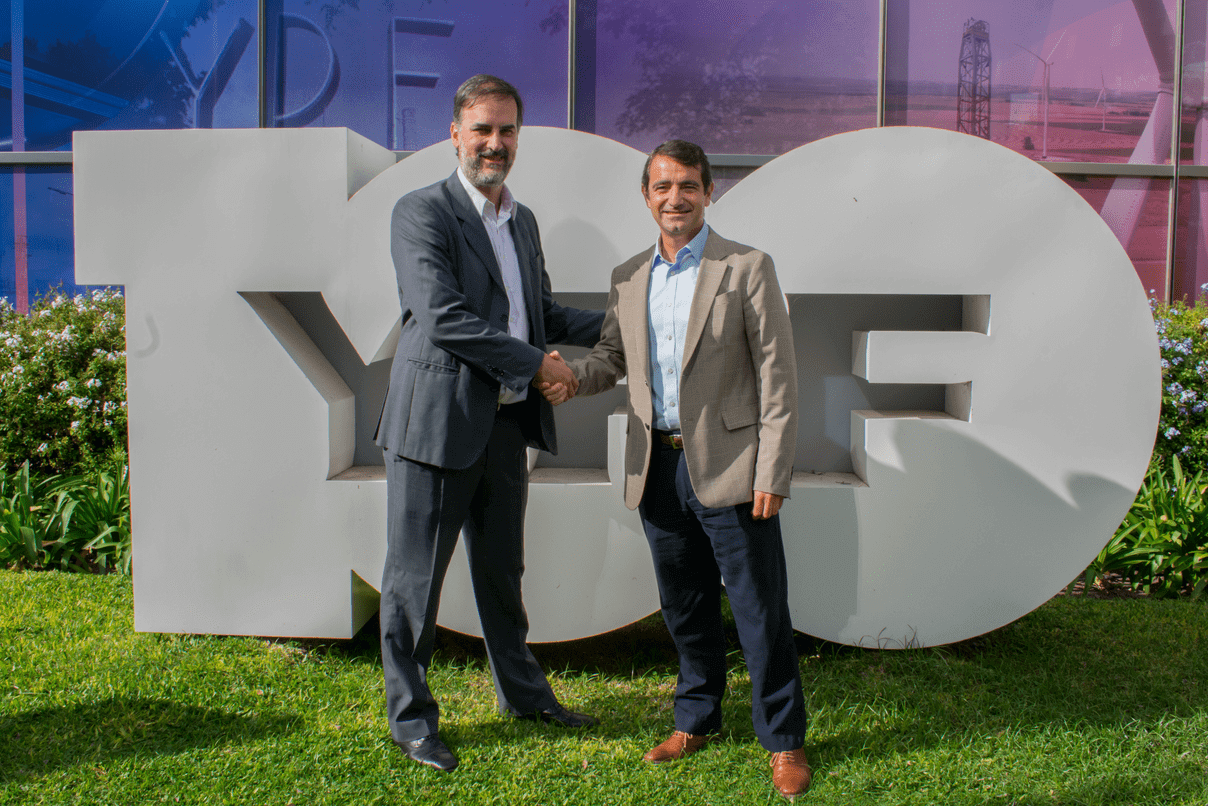
Acquisition and Operation of Central Dock Sud
Incorporation of one of the most efficient thermal power plants in the country.
Located in AMBA (Buenos Aires Metropolitan Area), CDS has an installed capacity of 870MW,
equivalent to the energy used by more than 1,490,000 homes.
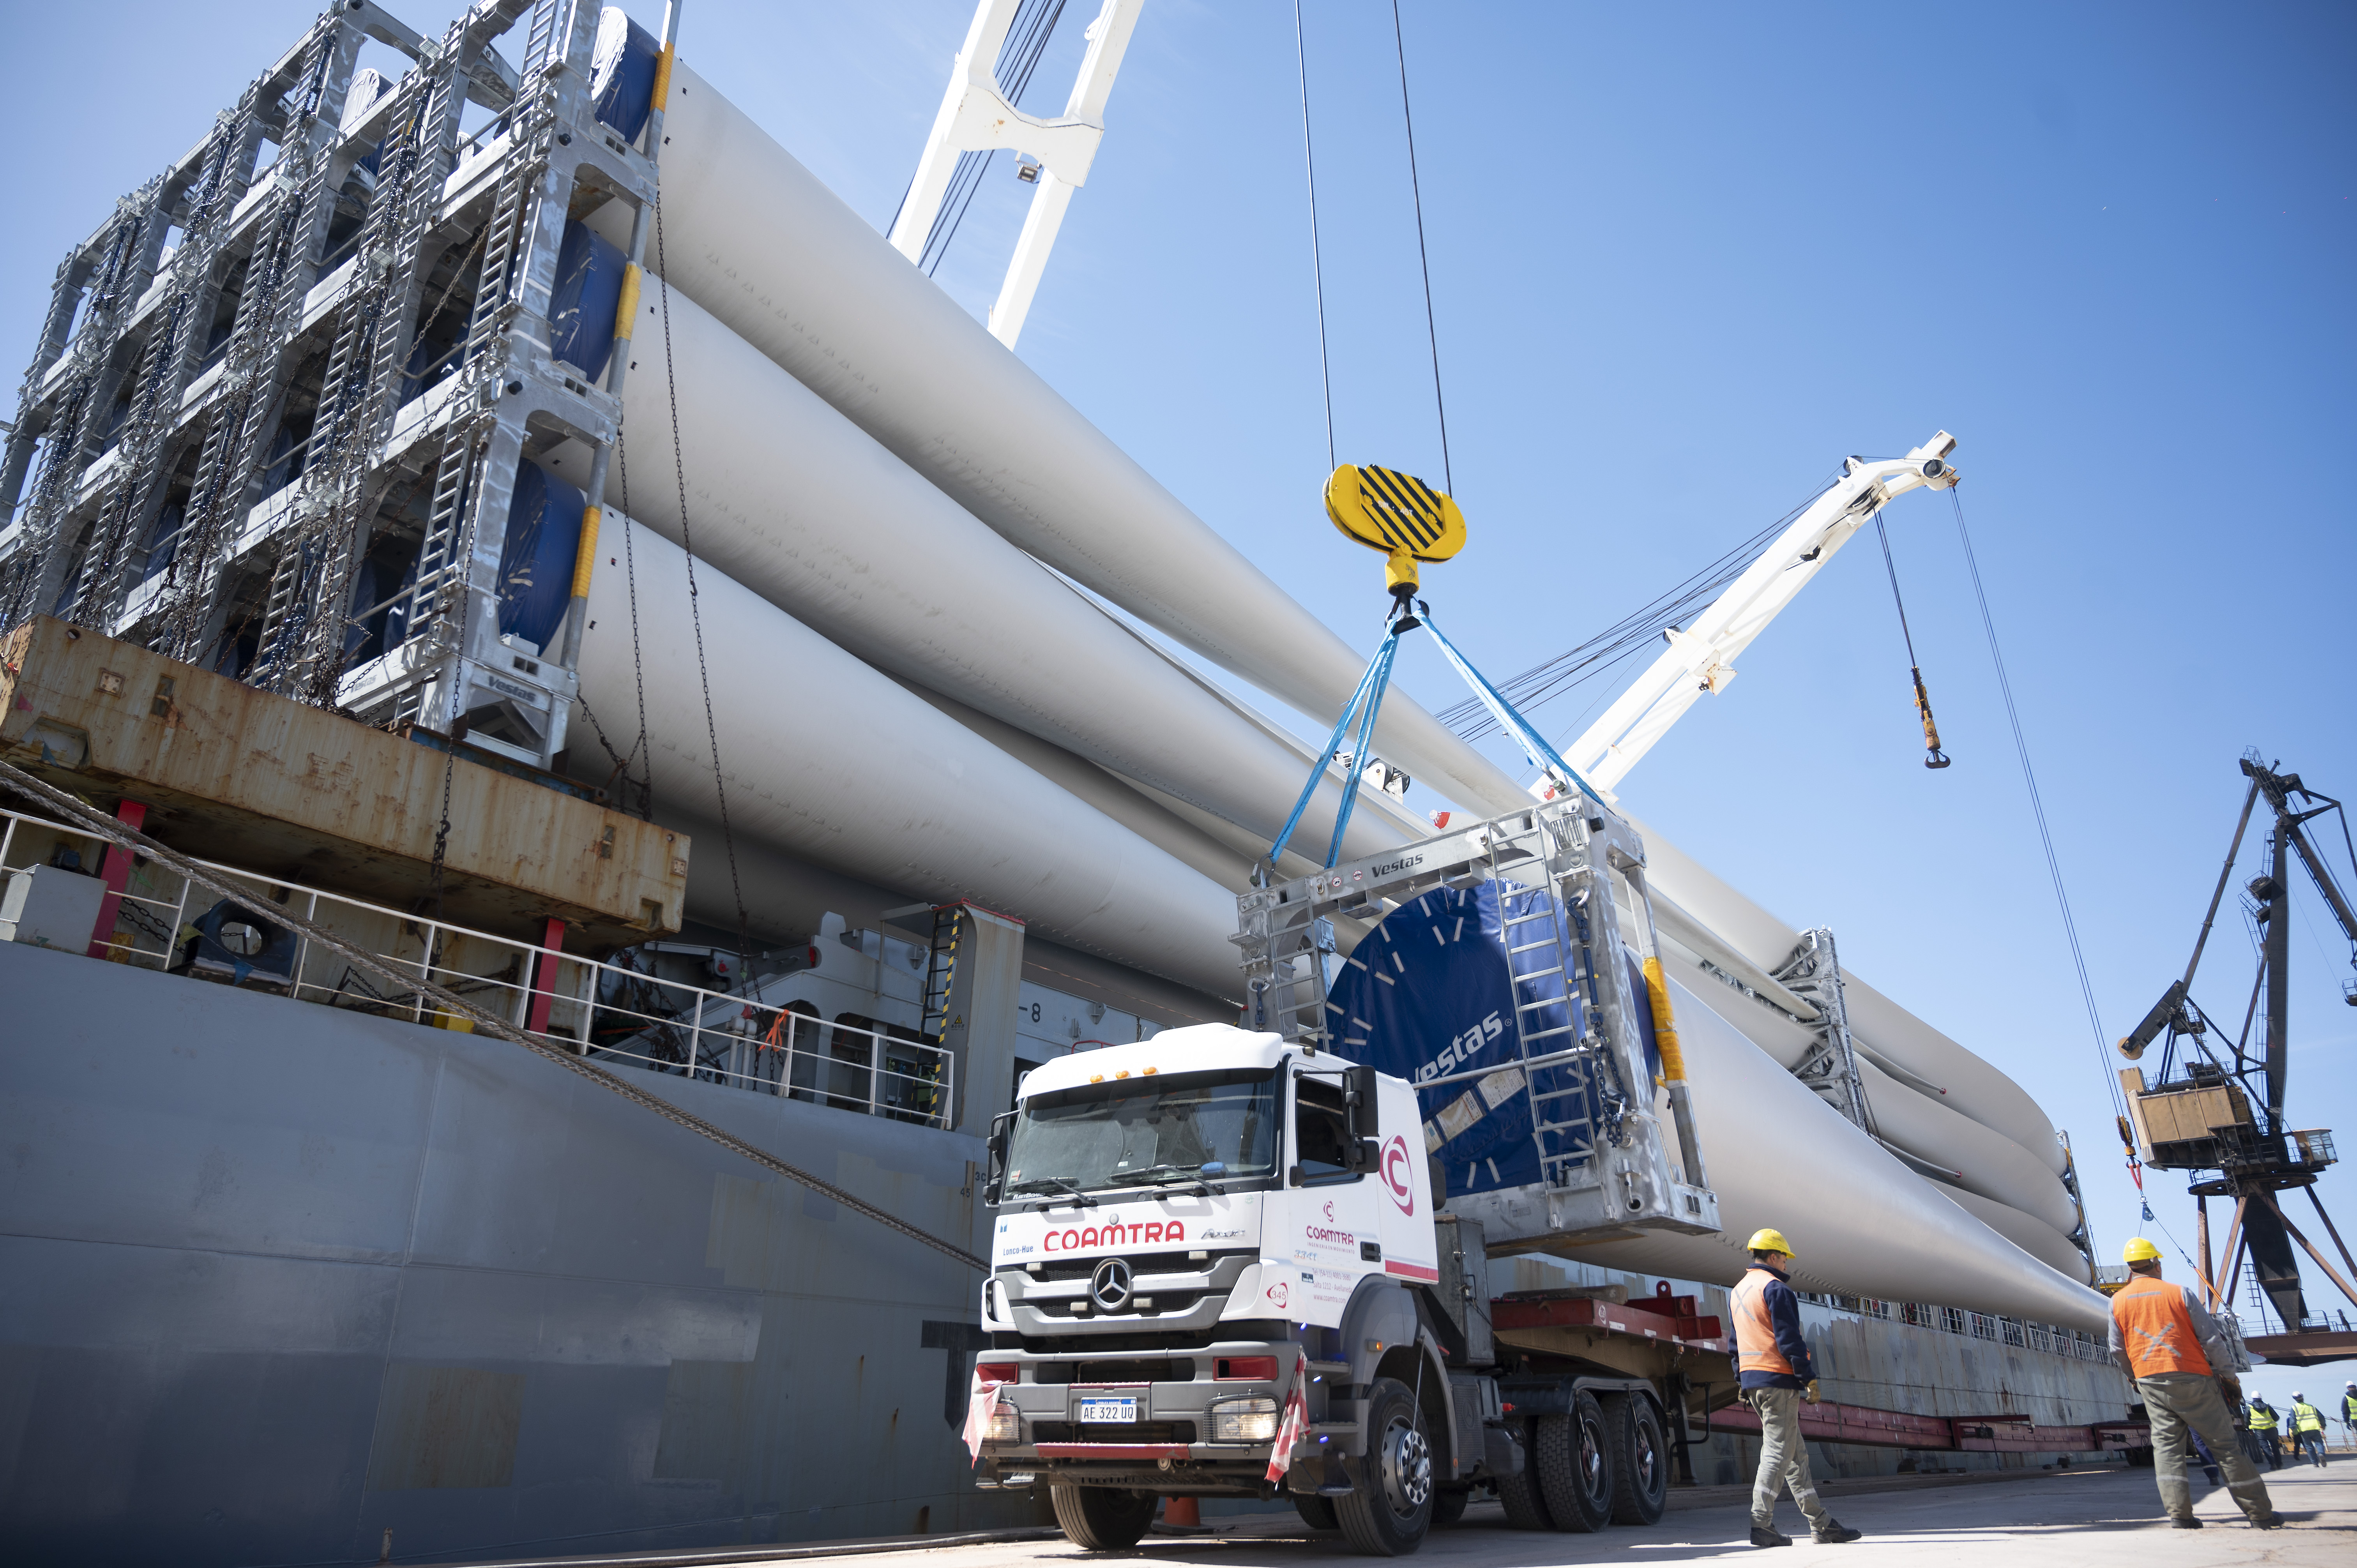
General Levalle Wind Farm
Start of construction of our fourth wind farm in Cordoba, with an investment of more than 260 million dollars.
The General Levalle Wind Farm will have 25 wind turbines with an installed capacity of 155 MW,
which is equivalent to the consumption of more than 190,000 homes,
generating a reduction of 350,000 tons of CO2 per year.
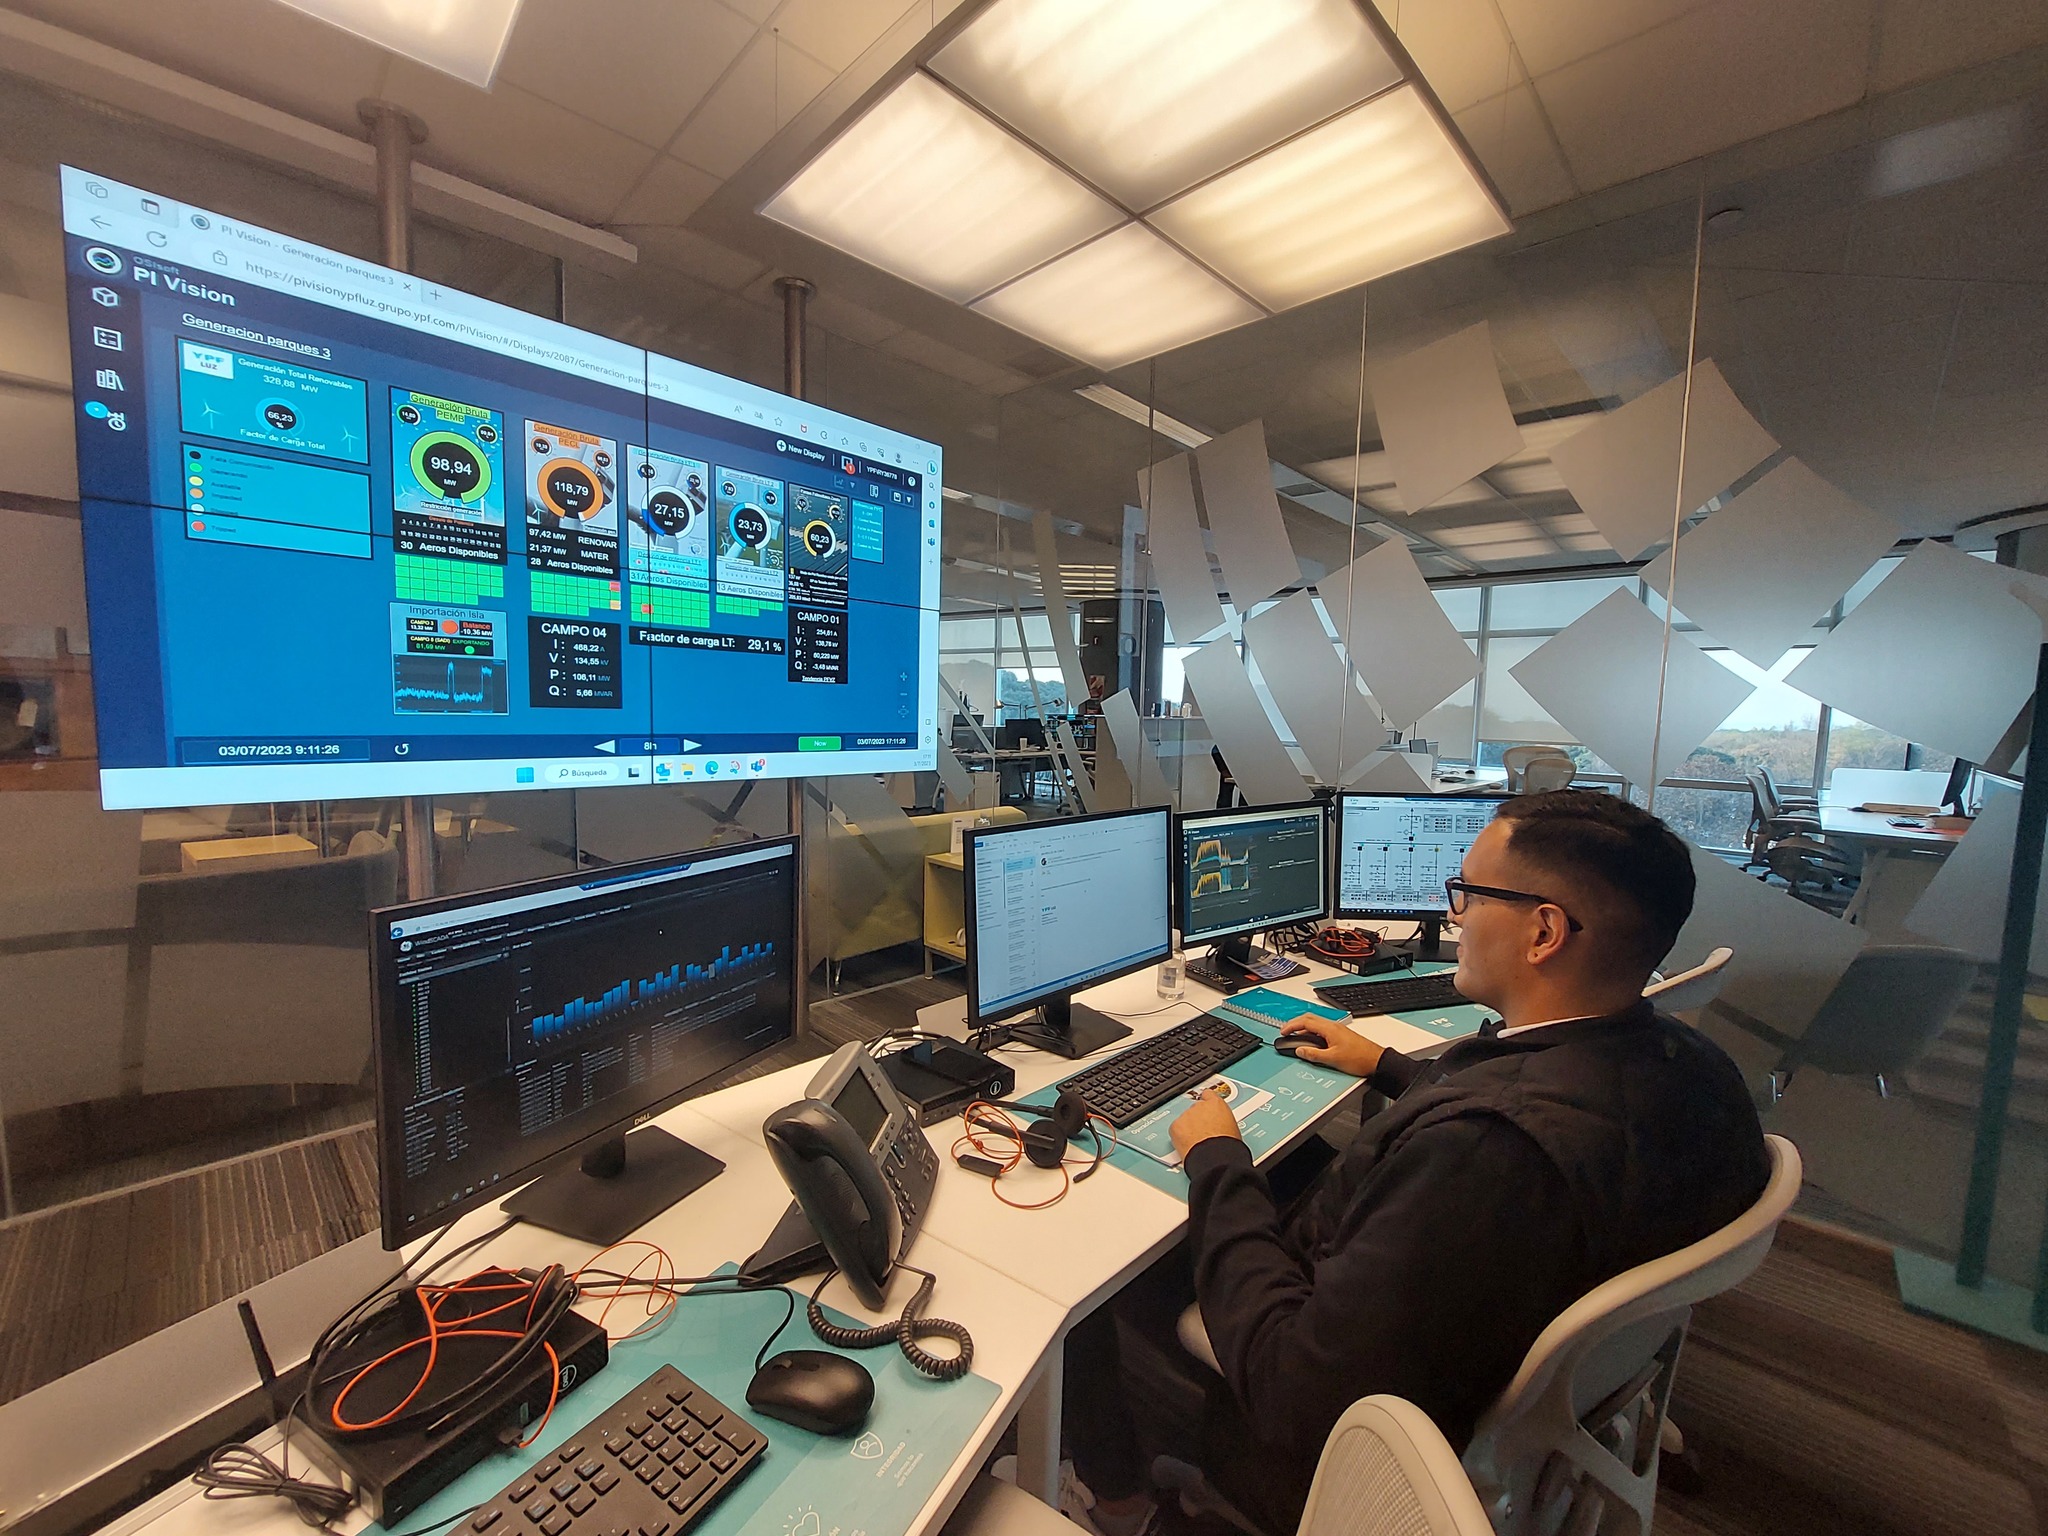
Renewables Remote Operation Center
A very important step in terms of innovation and efficiency. The Remote Operation Center (COR) oversees and operates all the company's renewable assets, from Torre Puerto Madero, in the city of Buenos Aires.
ENVIRONMENTAL PERFORMANCE

Renewable energy sold (GWh/year)
+7% vs 2022
Renewable installed capacity
/ total installed capacity
-11% vs 2022
Wind farms with monitoring system of flying fauna
Recovered Waste
/Total Waste
-23% vs 2022
Total Water
Consumption
+3% vs 2022 (ML)
9 Power plants with energy efficiency certification
GHG emissions
avoided (tn CO2 e)
+2.5% vs 2022
Trees for forestation
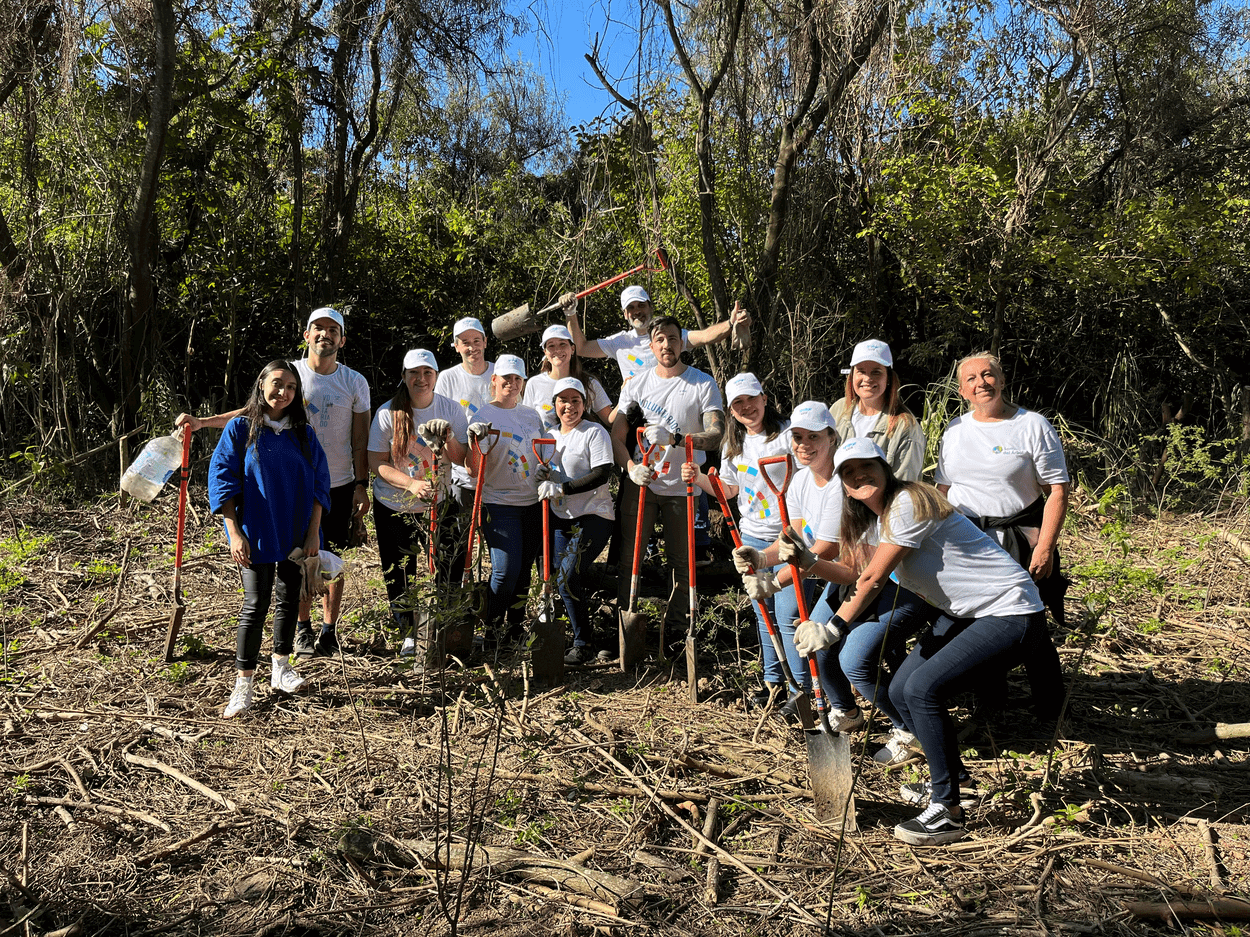
SOCIAL PERFORMANCE

COMMUNITY
Activities of volunteering
Environmental & partner investment
+105% vs 2022
Beneficiaries
+60% vs 2022
Employee volunteers
+19% vs 2022
University
scholars
Site Visits

OUR TEAM
IFA (Accident Frequency Index)
Annual medical examinations performed
Average number of training hours per employee
Contingency Drills and Training
Preventive Observations

VALUE CHAIN
Domestic purchases
Suppliers
ESG-trained suppliers
Customers
+92% vs 2022
Client NPS
ECONOMIC PERFORMANCE

U$SMM 490.1
REVENUE
+1% vs 2022
U$SMM 452.6
EBITDA
+14% vs 2022

U$SMM 252.3
INVESTMENT
+72% vs 2022
GOVERNANCE
100%
Operations certified under ISO 37.001 (Anti-Bribery Management System)
100%
Critical third party integrity due diligence
90%
Management Committee trained in Compliance
46%
Critical suppliers trained in Compliance
18%
of women in Steering Committee
12.5%
Women Board Members